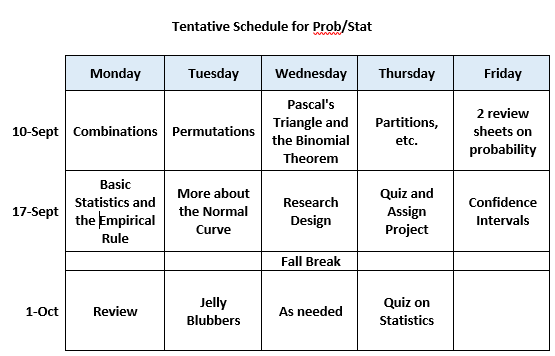
September 10: Permutation PPT
Assignment: From the Auxiliary text: Pg. 588: 71 - 78 and pg. 634: 3, 9 – 25 odd, 35 - 39, 43, 46,
55 - 81 odd, 87 - 90
September 11: Combination PPT Continue working on previous assignment
September 12: Pascal's Triangle Mathphile video https://www.youtube.com/watch?v=0iMtlus-afo
Part of a Ted Talk video https://www.youtube.com/watch?v=XMriWTvPXHI
Assignment: From the Auxiliary text: Pg. 624: 9, 21, 37, 51, 53, 59, 61, 67, 69, 107
Work on Probability Worksheet
September 13: Continue to work on the probability worksheet and
From the auxiliary text: Pg. 645: Vocab 1 - 8, 3, 5, 6, 9, 13, 18, 21, 24, 34, 37, 41 - 42, 46, 49 - 51, 55,
57* Make the graph of the probability distribution, 60, 63
Answers to the probability worksheet: 1) 125 2) 8,000,000 3) 100,000 4) 720 5) 3360
6) 44,352 7) 315 8) 21,700 9) 126 10) 120 11) 20
September 14: Answers to "Don't you just love probability"
Answers to the Probability Problems on the Back And these are some of the problems on the second review sheet.
Here are the answers to the Probability Review for all levels that you got Thursday or Friday.
September 17: Binomial Notes:
For a situation to be considered as having a binomial distribution, the following must be satisfied:
• Each observation/trial has one of two outcomes. These two outcomes are referred to as “success” or “failure”.
• There are a fixed number of observations/trials. The number of observations/trials is referred to as n.
• The observations/trials must be independent.
• The probability of success, referred to as p, is the same for each observation/trial.
September 18: Here are objectives for the probability quiz. Study all the worksheets we've done.
September 19: And here is the review ppt from today.
September 20: Students took the quiz today and the assignment is read "Statistical Experiments and Sampling"
September 21: A) Students received the "Testing Task" that is due Wednesday, October 3 and will be graded as a lab to go in the
lab/quiz grade category. The ordered pairs "Grade, Frequency" for this lab are: (15, 1), (20, 4), (25, 3), (30, 4),
(35, 5), (40, 18), (45, 13), (50, 32), (55, 15) (60, 6), (65, 9), (70, 1), (75, 6), (80, 2)
B) Students received the "Statistics Project" which counts their test for this unit and is due October 16. The only
part due soon is the 2 well written questions they are asking in their survey and I need to have those by Oct. 2.
C) We looked at statistics to predict means, so we found sample means the same way you find population means,
the sample variance by dividing the squared differences from the mean by n-1 (the degrees of freedom)instead
of n, and the sample standard deviation by taking the square root of the sample variance. (The sample standard
deviation will be larger than the population standard deviation.) Then we found the standard error of the means
by dividing the sample standard deviation by the square root of n. (This means our margin of error is the product
of the appropriate z score for the confidence level and the standard error.) And finally, we added and subtracted this margin of error to the mean to get a confidence interval for the true population mean. The assignment for
the break is to practice this concept using the problems from the worksheet we got today.
***********I need to check your probability homework, so please bring to school on Monday:
Pg. 588: 71 - 78 and pg. 634: 3, 9 – 25 odd, 35 - 39, 43, 46, 55 - 81 odd, 87 - 90
Pg. 624: 9, 21, 37, 51, 53, 59, 61, 67, 69, 107
"Probability Review for All Levels" worksheet
The "Card Draw Problem/Ten first-graders" worksheet
"Don't you just LOVE Probability"
"Analysis Worksheet: Z-Scores and Percentile Rank"
Fall Break Assignment! James Tanton has made a series of short problem solving videos at http://www.maa.org/node/129058 called 10 Strategies With Examples. Watch these over the break! They don't take long and are really quite good. (Be delighted with his accent and amazed at his ability to write backwards!)
Mathletes, watch more of these videos, pausing after the initial question to work the problem. These other videos show strategies to solve to several AMC problems.
After Break!!!
Monday, October 1: I took up homework, gave back and answered questions over the probability quizzes and answered other questions as needed about probability or the statistics we have done so far. We decided that the midterm will be Thursday, October 11, since that is an early release day and you will have longer to take the test. The midterm will count as a test grade (27 questions total - most multiple choice) but I will also write it in 3 sections (Systems/Matrices, Conics, Probability) of 9 questions each. I will multiply the number of questions you answer correctly in each section by 11 and if that number is higher than your respective test/quiz, I will replace the original grade with the new number.
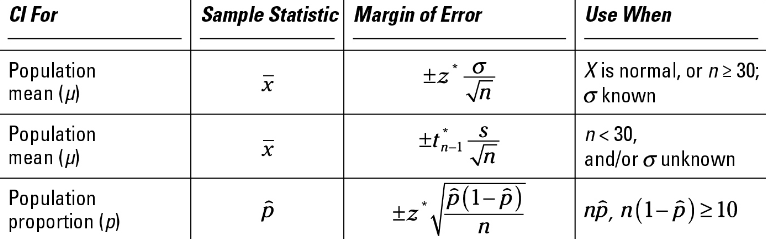
Tuesday, October 2: We reviewed the concept of a confidence interval for the mean of a population given a sample data set and remembered that:
The margin of error is the product of the Z-score* for the appropriate confidence level and the sample standard deviation divided by the square root of the sample size.
The confidence interval for the population mean is the sample mean plus or minus the margin of error.
This led to the concept for the confidence interval for a proportion, which is the sample proportion + or - the Z-score for the appropriate confidence level times the square root of (the product of the sample proportion and (1-sample proportion) divided by the sample size). The table below has the exact formulas including the differences between using Z and t scores.
Assignment: From the Auxiliary text: Pg. 588: 71 - 78 and pg. 634: 3, 9 – 25 odd, 35 - 39, 43, 46,
55 - 81 odd, 87 - 90
September 11: Combination PPT Continue working on previous assignment
September 12: Pascal's Triangle Mathphile video https://www.youtube.com/watch?v=0iMtlus-afo
Part of a Ted Talk video https://www.youtube.com/watch?v=XMriWTvPXHI
Assignment: From the Auxiliary text: Pg. 624: 9, 21, 37, 51, 53, 59, 61, 67, 69, 107
Work on Probability Worksheet
September 13: Continue to work on the probability worksheet and
From the auxiliary text: Pg. 645: Vocab 1 - 8, 3, 5, 6, 9, 13, 18, 21, 24, 34, 37, 41 - 42, 46, 49 - 51, 55,
57* Make the graph of the probability distribution, 60, 63
Answers to the probability worksheet: 1) 125 2) 8,000,000 3) 100,000 4) 720 5) 3360
6) 44,352 7) 315 8) 21,700 9) 126 10) 120 11) 20
September 14: Answers to "Don't you just love probability"
Answers to the Probability Problems on the Back And these are some of the problems on the second review sheet.
Here are the answers to the Probability Review for all levels that you got Thursday or Friday.
September 17: Binomial Notes:
For a situation to be considered as having a binomial distribution, the following must be satisfied:
• Each observation/trial has one of two outcomes. These two outcomes are referred to as “success” or “failure”.
• There are a fixed number of observations/trials. The number of observations/trials is referred to as n.
• The observations/trials must be independent.
• The probability of success, referred to as p, is the same for each observation/trial.
September 18: Here are objectives for the probability quiz. Study all the worksheets we've done.
September 19: And here is the review ppt from today.
September 20: Students took the quiz today and the assignment is read "Statistical Experiments and Sampling"
September 21: A) Students received the "Testing Task" that is due Wednesday, October 3 and will be graded as a lab to go in the
lab/quiz grade category. The ordered pairs "Grade, Frequency" for this lab are: (15, 1), (20, 4), (25, 3), (30, 4),
(35, 5), (40, 18), (45, 13), (50, 32), (55, 15) (60, 6), (65, 9), (70, 1), (75, 6), (80, 2)
B) Students received the "Statistics Project" which counts their test for this unit and is due October 16. The only
part due soon is the 2 well written questions they are asking in their survey and I need to have those by Oct. 2.
C) We looked at statistics to predict means, so we found sample means the same way you find population means,
the sample variance by dividing the squared differences from the mean by n-1 (the degrees of freedom)instead
of n, and the sample standard deviation by taking the square root of the sample variance. (The sample standard
deviation will be larger than the population standard deviation.) Then we found the standard error of the means
by dividing the sample standard deviation by the square root of n. (This means our margin of error is the product
of the appropriate z score for the confidence level and the standard error.) And finally, we added and subtracted this margin of error to the mean to get a confidence interval for the true population mean. The assignment for
the break is to practice this concept using the problems from the worksheet we got today.
***********I need to check your probability homework, so please bring to school on Monday:
Pg. 588: 71 - 78 and pg. 634: 3, 9 – 25 odd, 35 - 39, 43, 46, 55 - 81 odd, 87 - 90
Pg. 624: 9, 21, 37, 51, 53, 59, 61, 67, 69, 107
"Probability Review for All Levels" worksheet
The "Card Draw Problem/Ten first-graders" worksheet
"Don't you just LOVE Probability"
"Analysis Worksheet: Z-Scores and Percentile Rank"
Fall Break Assignment! James Tanton has made a series of short problem solving videos at http://www.maa.org/node/129058 called 10 Strategies With Examples. Watch these over the break! They don't take long and are really quite good. (Be delighted with his accent and amazed at his ability to write backwards!)
Mathletes, watch more of these videos, pausing after the initial question to work the problem. These other videos show strategies to solve to several AMC problems.
After Break!!!
Monday, October 1: I took up homework, gave back and answered questions over the probability quizzes and answered other questions as needed about probability or the statistics we have done so far. We decided that the midterm will be Thursday, October 11, since that is an early release day and you will have longer to take the test. The midterm will count as a test grade (27 questions total - most multiple choice) but I will also write it in 3 sections (Systems/Matrices, Conics, Probability) of 9 questions each. I will multiply the number of questions you answer correctly in each section by 11 and if that number is higher than your respective test/quiz, I will replace the original grade with the new number.
Tuesday, October 2: We reviewed the concept of a confidence interval for the mean of a population given a sample data set and remembered that:
The margin of error is the product of the Z-score* for the appropriate confidence level and the sample standard deviation divided by the square root of the sample size.
The confidence interval for the population mean is the sample mean plus or minus the margin of error.
This led to the concept for the confidence interval for a proportion, which is the sample proportion + or - the Z-score for the appropriate confidence level times the square root of (the product of the sample proportion and (1-sample proportion) divided by the sample size). The table below has the exact formulas including the differences between using Z and t scores.
Then we gathered data for the Jelly Blubber Task and should be uploading that here.https://goo.gl/forms/wgnuQpmbKh43YZ6W2
That lead to a discussion of the Central Limit Theorem, which states "Given a population with mean "mu" and standard deviation "sigma", if we take lots of randomly selected samples of size n, three statements are true:
1) The distribution of the all the sample means is approximately a normal distribution.
2) The mean of the samples will be approximately the mean of the population.
3) The standard deviation of the sample means should be the population standard deviation divided by the square root of n.
Wednesday, October 3: We cleared up concepts on the Testing Task which is due tomorrow. Here is last year's prob/stat quiz. Your quiz will be only over the statistics part and you may use a calculator on it.
Here are the Answers to Analysis Worksheet: Z-Scores and Percentile Rank
1. A) 184 B) 16 C) 69 D) 115 F) ( 29.78, 46.26) * This is NOT a 90% confidence interval for the mean. Why not?
2. A) 257 B) 824 C) 257 D) 280 F) normalcdf((175-158)/37, 9999999999) / normalcdf(140-158)/37, 9999999999) =63.58%
3. A) A: 6.68%, B: 24.13%, C: 38.29%, D: 24.13%, F: 6.68%
B) x > 74 => A, 74 > x > 60 =>B, 60 > x > 46 => C, 46 > x > 22 => D, x < 32 => F
C) x > 94.5 => A, 94.5 > x > 89.5 =>B, 89.5 > x > 84.5 => C, 84.5 > x > 79.5 => D, x < 79.5 => F
Answers to the Confidence Intervals Task: (Click to open this file)
Answers to the Assessing Opinions Assignment:
1a) (15.47%, 24.53%) b) Yes, because 8% is not in my 95% confidence interval for the percentage of students who are left-handed. This means this sample is an anomaly.
2a) (54.46%, 65.54%) b) Yes, because 10% is not in my 95% confidence interval for the percentage of students who have allergies or asthma. This means this sample is an anomaly.
3a) (29.64%, 90.36%) b) No, the sample size is way too small to give a decent confidence interval. (It includes values as low as 30% which isn't even better than guessing.)
4a) (78.54%, 87.73%) b) No, the 95% confidence interval doesn't contain 50% which would mean either would be equally likely. Therefore holding a baby on the left is the more common option.
5a) (18.96%, 27.04%) b) Yes, because 35% isn't in the 95% confidence interval for those who do not drink. Therefore this sample is anomaly.
6a) (35.56%, 38.24%) b) My friend would be correct if their estimation was within that confidence interval.
Answers to the Types of Samples exercises:
1. Systematic
2. Random
3. Cluster
4. Stratified
5. Convenience
6. Stratified
7. Stratified
8. Cluster
9. Cluster
10. Systematic
11. Random
12. Convenience
13. People don't always know the correct answer or they round off. Some will lie, especially if they feel an incorrect answer looks "better".
14. Sampling errors result from the actual sampling process, such as the type of error that occurs when the sample size is too small or not random. Nonsampling errors occur from other external factors such as a defective measuring device.
15. Poorer people might not have phones or won't be willing to pay the cost of the call so you won't get a representative sample of the population. Only passionate people with strong opinions will bother to call so you won't get a random sample.
16. a) No, there isn't universal agreement about what a passenger car is because some people don't know how to classify SUV, jeeps, minivans, trucks, etc. b) Some types of vehicles are more popular than others in certain regions of the country. For example, in farming communities, trucks are more popular, while compact vehicles are more popular in larger or older cities. c) A sample might be obtained from car registration or title records.
17. Open-ended: A wider variety of (and sometimes more honest or creative) responses are available with open ended questions. However, sometimes the responses are harder to understand. Closed: They force choices to be made which is an advantage. However, it is sometimes a challenge to consider all options when constructing these questions. However, it is easier to analyze data with closed questions because you limit the responses to a category.
This is a decent list of objectives for the statistics quiz.
Thursday, October 4: We cleared up calculator challenges in 1st period, went over the quiz in ASE and answered various questions in 2nd.
A wise student asked for a copy of the z-score worksheet to review and I found this one z-scores_and_percentile_rank.docx, which has some answers included. I hope it helps and I'm still looking for an electronic copy of the one you got.
